3.135.217.212
Climate of the troposphere
The temperature of the troposphere is measured by satellites nearly everywhere on the earth. It is also possible to analyze the temperature of several atmospheric layers separately.The resulting RSS data is provided by ▸Remote Sensing Systems.
Global temperature
The following diagram shows the global temperature of the lower troposphere. The monthly anomalies from 1979 to date are displayed.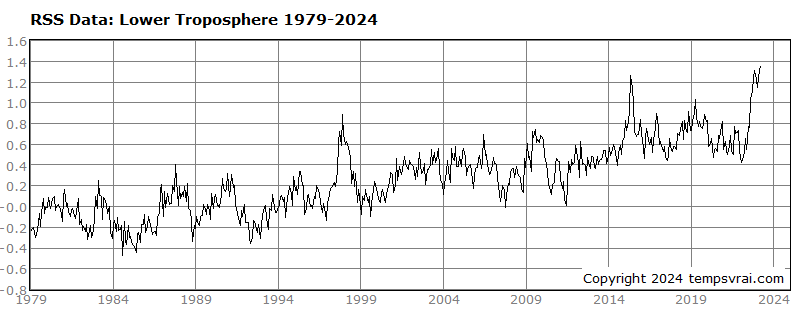
Temperature of the northern and southern hemisphere
The second diagram shows the global temperature of the lower troposphere separated into northern and southern hemisphere. The monthly anomalies from 1979 to date are displayed. Northern hemisphere red, southern hemisphere blue.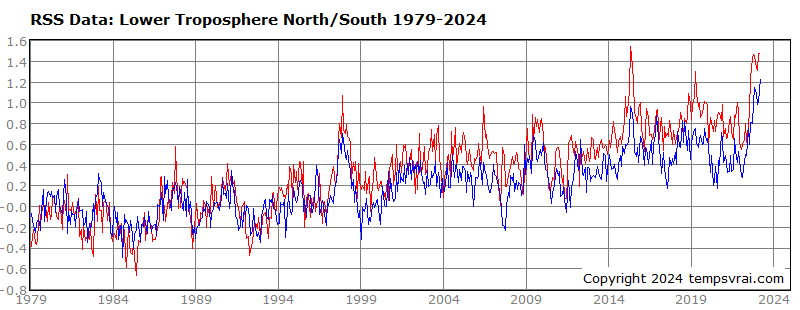
Since the early nineties the difference of the anomalies has increased between the northern and southern hemisphere. According to this the warming of the northern hemisphere was more developed. The slow decline of the global temperature during the last ten years results mostly from the trend of the southern hemisphere.
Temperature of the land and sea surface
The following diagram shows the global temperature for land (red) and sea surface (blue).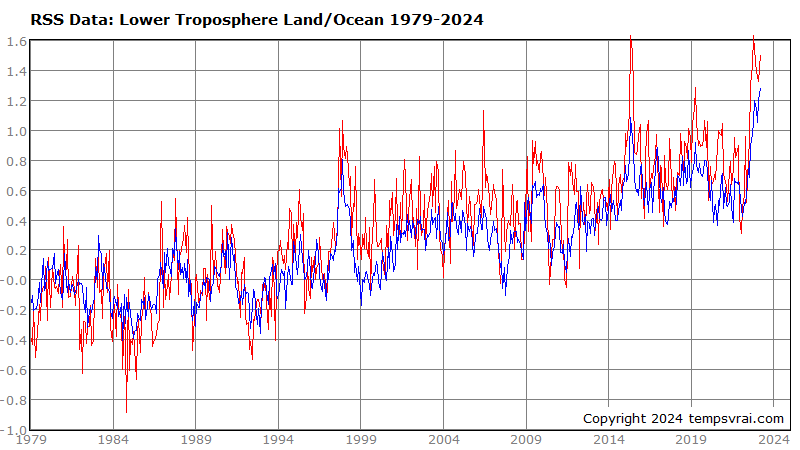
Temperature of the land surface in several regions
The following diagram shows the global temperature for several land regions: tropics (green), north of the tropics (red), and south of the tropics (blue).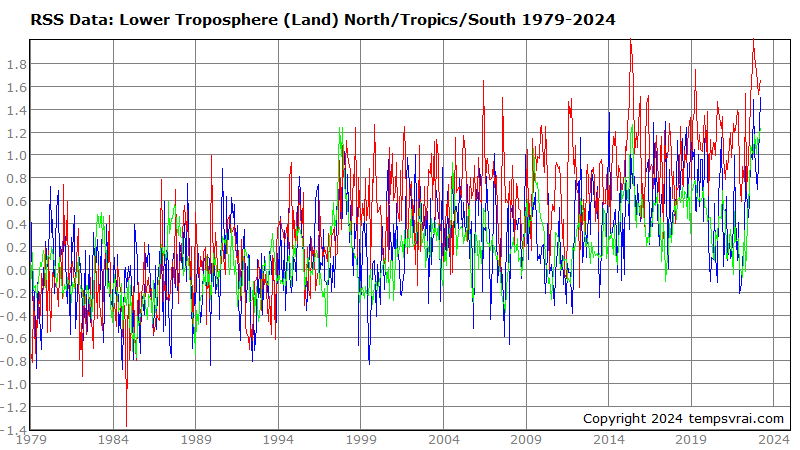
Temperature of the sea surface in several regions
The following diagram shows the global temperature for several sea surface regions: tropics (green), north of the tropics (red), and south of the tropics (blue).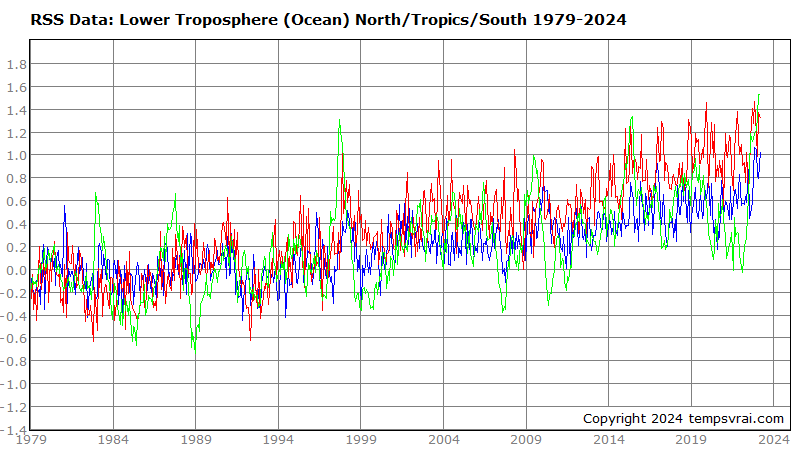
← Back
↑ Top of the page
MORE THEMES
weather.plus
P.O.Box 1206, 55280 Nierstein, Germany
Email: info@weather.plus
© tempsvrai.com 1992-2024
All rights reserved.
P.O.Box 1206, 55280 Nierstein, Germany
Email: info@weather.plus
© tempsvrai.com 1992-2024
All rights reserved.


