18.216.186.164
Solar activity. Total solar irradiance. Diagram of the TSI.
Total solar irradiance / TSI
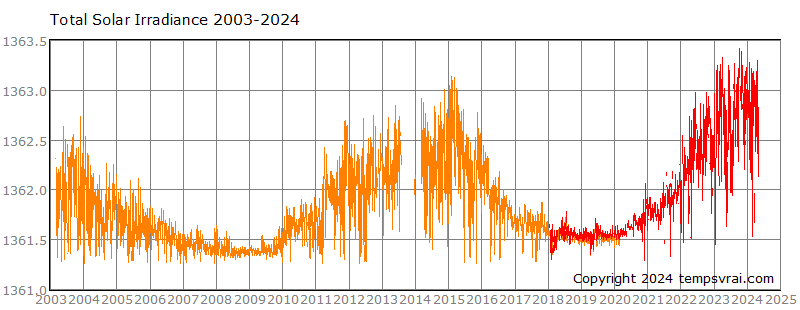
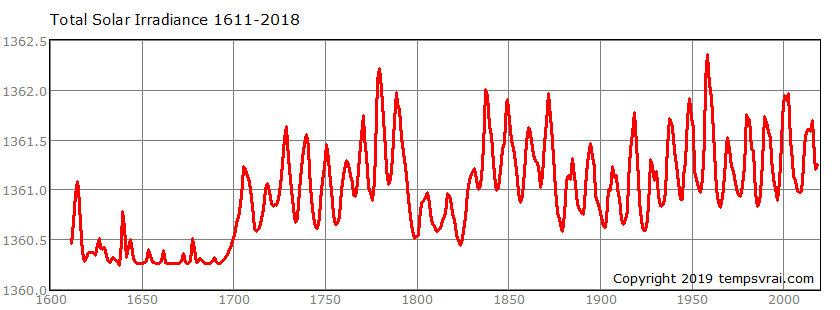
The following diagrams are showing the changes in the reconstructed total solar irradiance since 1610 (SORCE/TIM TSI Reconstruction) and the observations by satellite since the beginning of 2003.
The total solar radiation persisted in recent decades at a very high level, while the sunspot numbers declined significantly during the same period.
Note: The following diagram shows two data sets: The data from the SORCE satellite, which was switched off after 17 years on February 25, 2020, and the more recent measurements from the TSIS satellite, which started in January 2018. The SORCE data affected by the aging of the satellite has been corrected upwards by 0.5 watts.
Daily values of the TSI since 2003:

(Click for a larger view)
Annual values of the TSI since 1610 to date:

(Click for a larger view)
← Back
↑ Top of the page
MORE THEMES
weather.plus
P.O.Box 1206, 55280 Nierstein, Germany
Email: info@weather.plus
© tempsvrai.com 1992-2024
All rights reserved.
P.O.Box 1206, 55280 Nierstein, Germany
Email: info@weather.plus
© tempsvrai.com 1992-2024
All rights reserved.


