18.222.69.152
Southern Oscillation Index
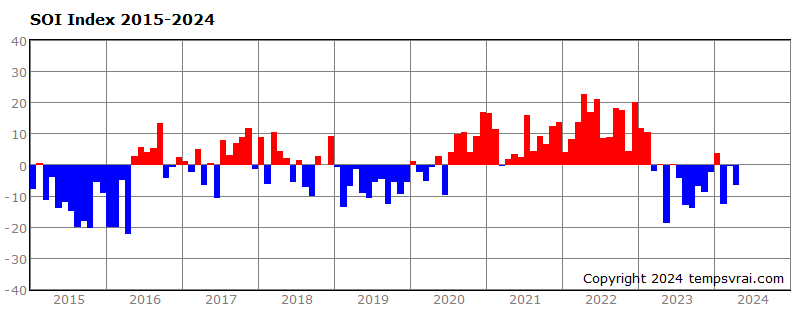
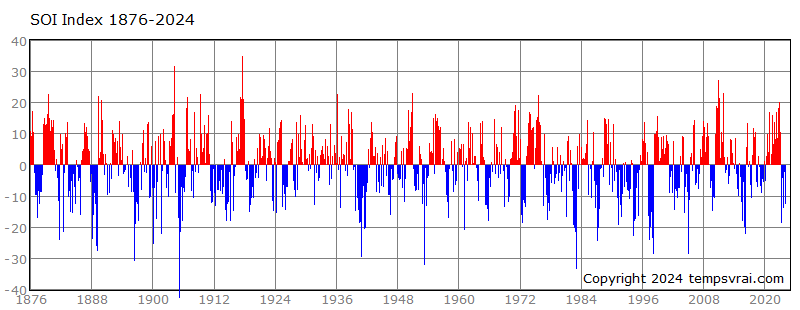
The following diagrams show the current situation of the Southern Oscillation Index. This so-called SOI index is calculated from the difference between the air pressure values of the central Pacific island of Tahiti and the northern Australian city of Darwin. Therefore, the Southern Oscillation reflects the atmospheric situation over the western Pacific.The positive values represent La Niña events, negative values El Niño events (conversely to ENSO Index).
The last 10 years:
(Click for a larger view)Monthly values since 1876 to date:
(Click for a larger view)
← Back
↑ Top of the page
MORE THEMES
weather.plus
P.O.Box 1206, 55280 Nierstein, Germany
Email: info@weather.plus
© tempsvrai.com 1992-2024
All rights reserved.
P.O.Box 1206, 55280 Nierstein, Germany
Email: info@weather.plus
© tempsvrai.com 1992-2024
All rights reserved.


