52.14.85.76
El Niño - La Niña
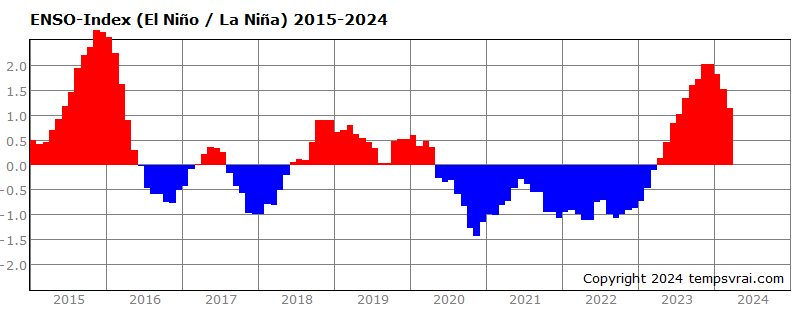
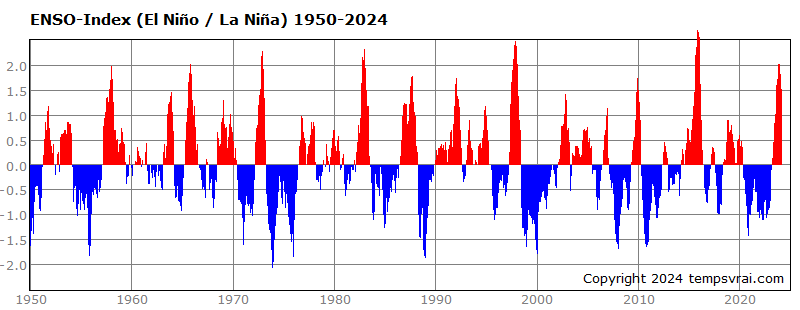
The following diagrams show the ENSO Index, which describes the anomaly of the temperature in the East Pacific. The events of the warm El Niño (red) and the cold La Niña (blue) are clearly visible.
The last 10 years:
(Click for a larger view)Von 1950 bis heute:
(Click for a larger view)
← Back
↑ Top of the page
MORE THEMES
weather.plus
P.O.Box 1206, 55280 Nierstein, Germany
Email: info@weather.plus
© tempsvrai.com 1992-2024
All rights reserved.
P.O.Box 1206, 55280 Nierstein, Germany
Email: info@weather.plus
© tempsvrai.com 1992-2024
All rights reserved.


